Observability Implementation with Grafana
Full-stack visibility and faster incident response through a centralized observability platform
+80%
Incident Detection
Anomalies caught early
-60%
Resolution Time
Root-cause diagnosis
100%
System Visibility
Full-stack monitoring
Client Overview
Innovative Technology Provider for Complex Engineering Environments
The Challenge
The lack of centralized visibility over the status and performance of applications caused unacceptable response times to critical failures, severely impacting service availability and customer trust. The operation was purely reactive and highly inefficient. We implemented a comprehensive monitoring, logging, and alerting platform that provides absolute control over the entire technology stack, allowing the team to anticipate problems and ensure flawless, uninterrupted operability.
Our Solution
We deployed a unified observability platform across the entire stack:
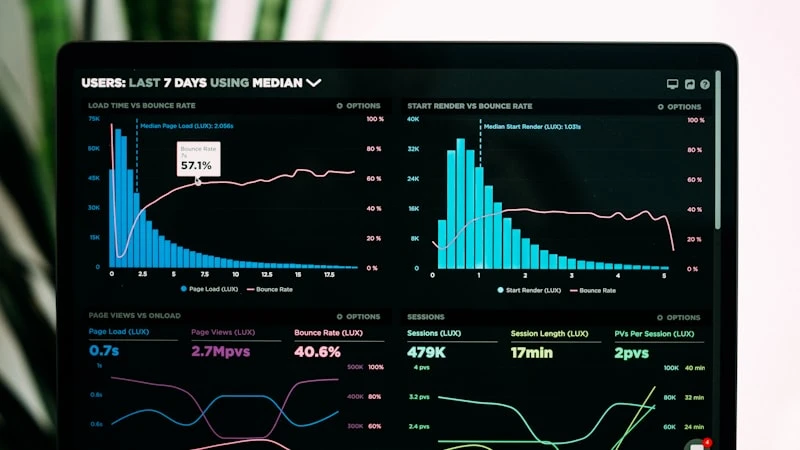
- Complete system visibility from a single interface: We deployed a unified observability platform on Grafana that covers infrastructure, application, and database from a single point of control.
- Incidents detected before impacting the business: We implement real-time alerts that detect performance anomalies before they escalate into disruptions for users.
- Faster and more accurate diagnosis: We centralize log management with Loki to correlate events between system layers and reduce incident resolution time.
- Real-time monitored security: We integrate Fail2Ban, CSF, and firewall logs to give the team continuous visibility into intrusion attempts and security events.
- Autonomous team to operate the platform: We provide complete documentation and practical training so that the team can maintain and evolve the observability system independently.
The team came out fully equipped to detect, diagnose, and resolve issues before they impact users.
Key Benefits
The observability platform delivered clear operational benefits:
- Full visibility across the entire stack — from infrastructure to application — replacing fragmented, disconnected monitoring tools
- Faster incident resolution through proactive alerts and unified log correlation that surfaces root causes quickly
- Improved security posture with real-time monitoring of intrusion attempts and firewall activity
- Internal team empowered to operate and evolve the observability platform independently
The team now owns and evolves its own observability stack.
Results
Problems started getting caught before anyone had to ask:
Centralized observability platform running on Grafana, Prometheus, and Loki across the full organization
Incident detection and resolution times reduced significantly through proactive alerts and unified log correlation
Integrated security monitoring with real-time visibility into attacks, intrusions, and firewall activity
Team equipped with full documentation and training to operate the platform autonomously long-term
Tech Stack
Tags
Related Service
Data & Analytics
Ready to Transform Your Business?
Let's discuss how we can help you achieve similar results.
Start a Project
Get Started
Let's talk about what really matters
If you're facing a complex or business-critical initiative, we help you bring clarity, assess options, and decide the right path forward—before execution begins.